Five selected features of the 1905 upgrade of SAP IBP
23 May 2019
In May 2019, SAP released the 1905 upgrade of SAP Integrated Business Planning (IBP). We have compiled a staff-picked list of five features of the IBP 1905 upgrade that we think your company can benefit from and that can leverage your supply chain planning to the next level.
Five selected features of the 1905 upgrade of SAP IBP
1. Driver-based planning allows keeping track of your business’ risks and opportunities and accounting for them in your supply chain plan
It is at the core of any planning process to predict, or better try to predict, what is going to happen in the future. This naturally includes a certain degree of uncertainty, and therefore assumptions are often made. Also, when a system automatically creates a plan, the plan might need to be reviewed and enriched with different inputs: for example, a demand planner might want to adjust a statistically calculated forecast based on newly gathered information about market changes and competitors.
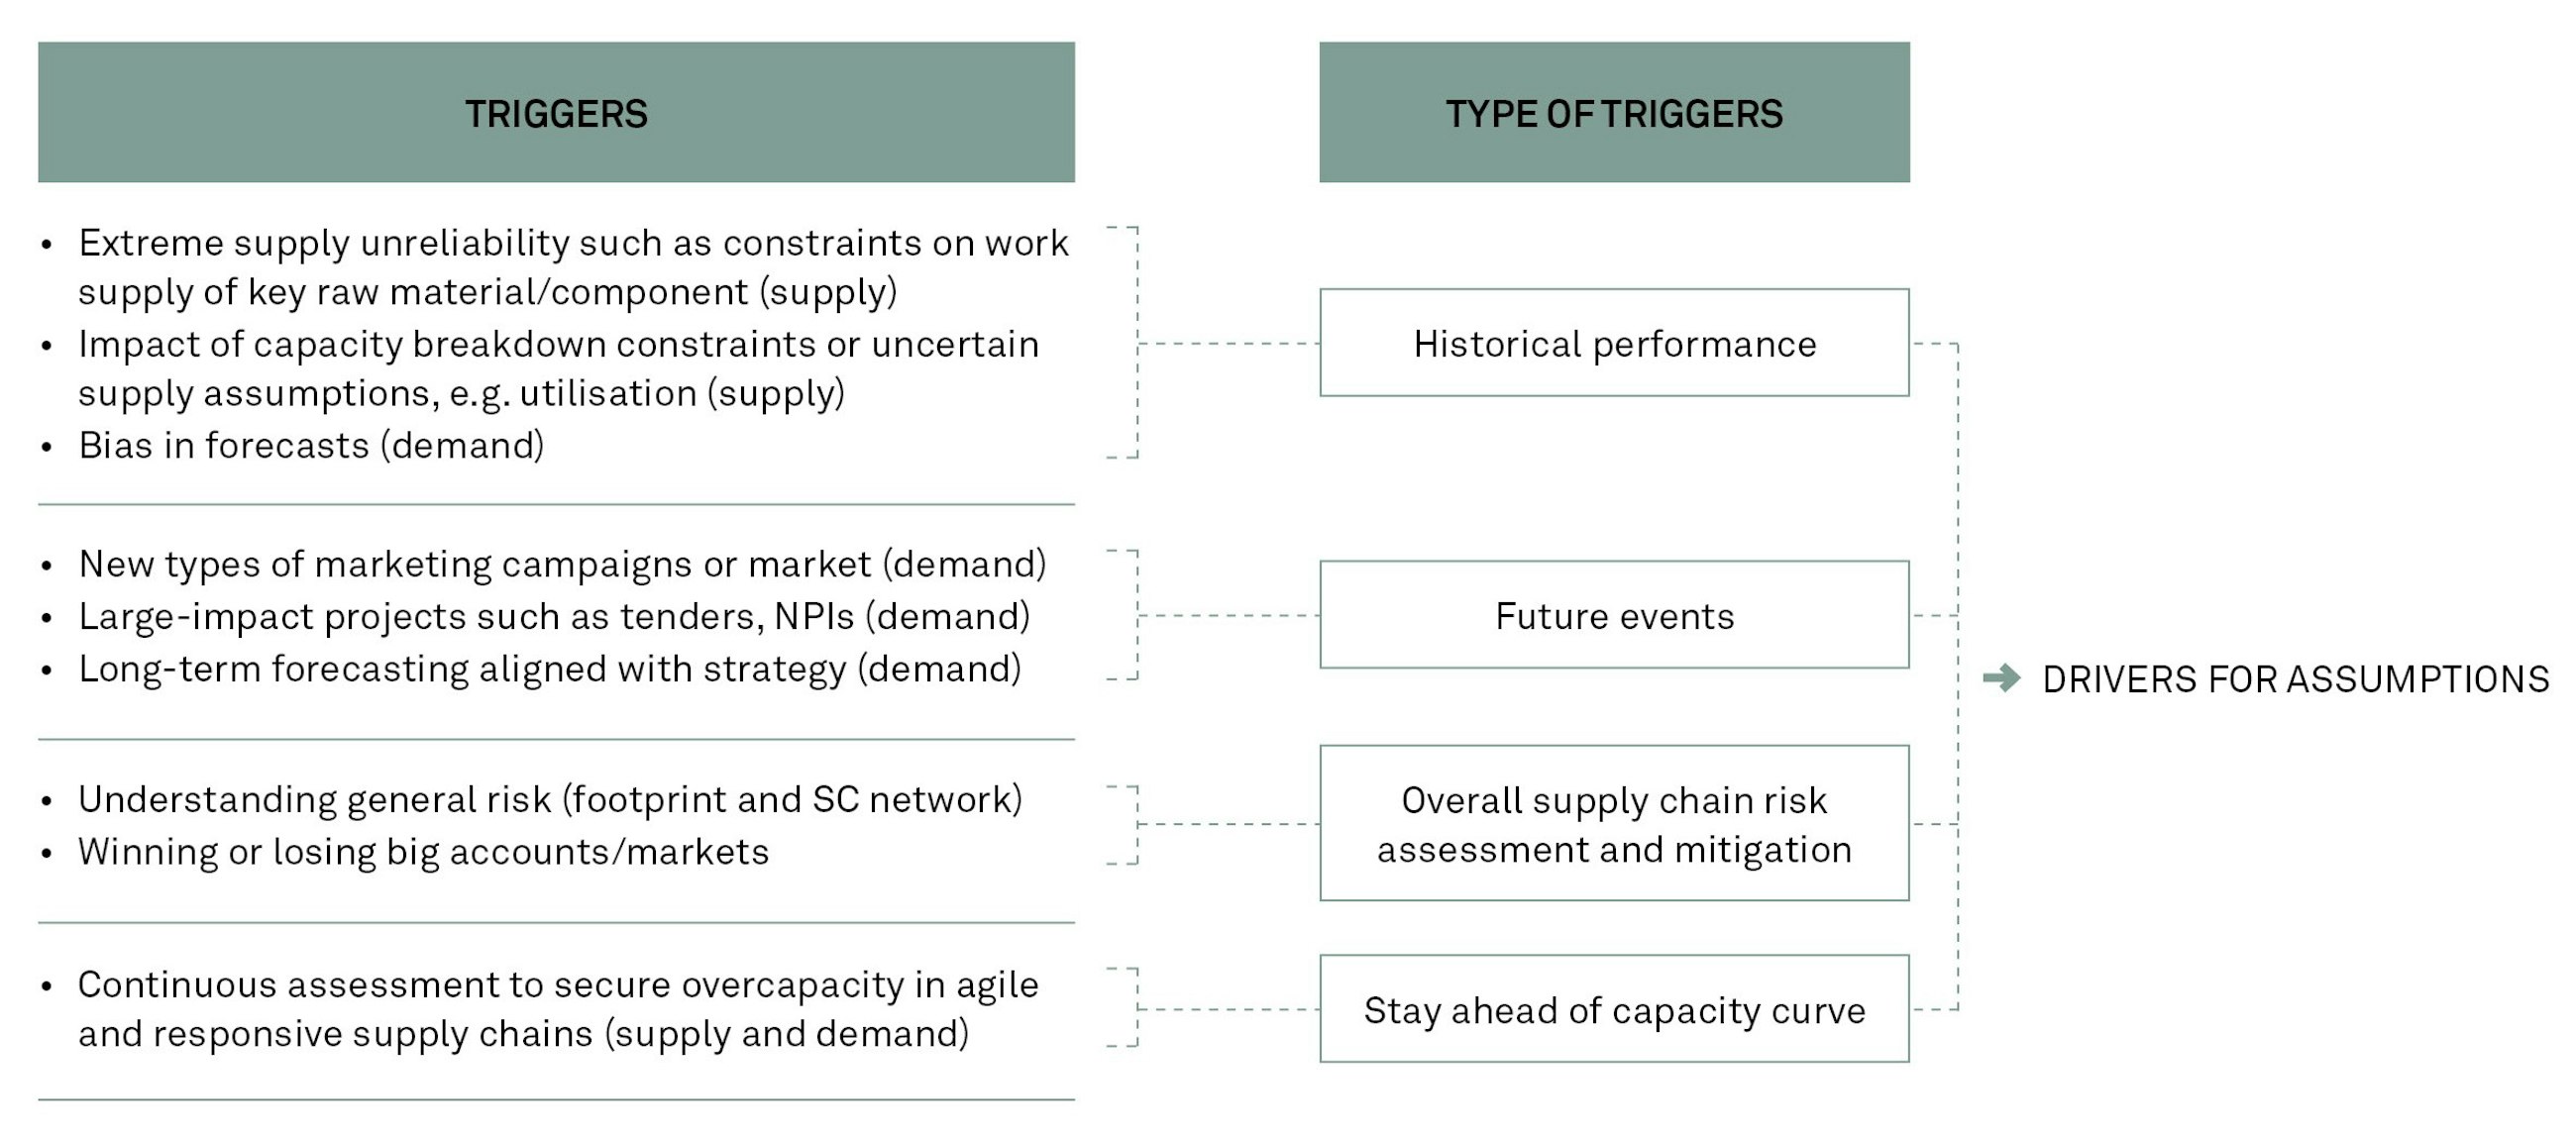
Risks and opportunities are drivers that can influence our supply chain plans and should therefore be carefully considered and used for scenario planning. There could be many drivers to consider, so we typically suggest clustering these “scenario triggers” depending on their type, as shown in the image below.
With the new app “Driver-Based Planning”, IBP provides you with a way to capture these drivers in a structured way with their quantitative but also qualitative information.
So how does it work? The app offers a space where planners can track supply chain drivers which might influence the plan. The user can create the drivers, describe them, assign to them a certain priority and time range, quantify them and define whether they should be included in the plan or not. There is a high degree of flexibility regarding which information can be tracked. IBP provides a sample configuration in the SAPIBP1 planning area that you can further customise to meet your business needs.
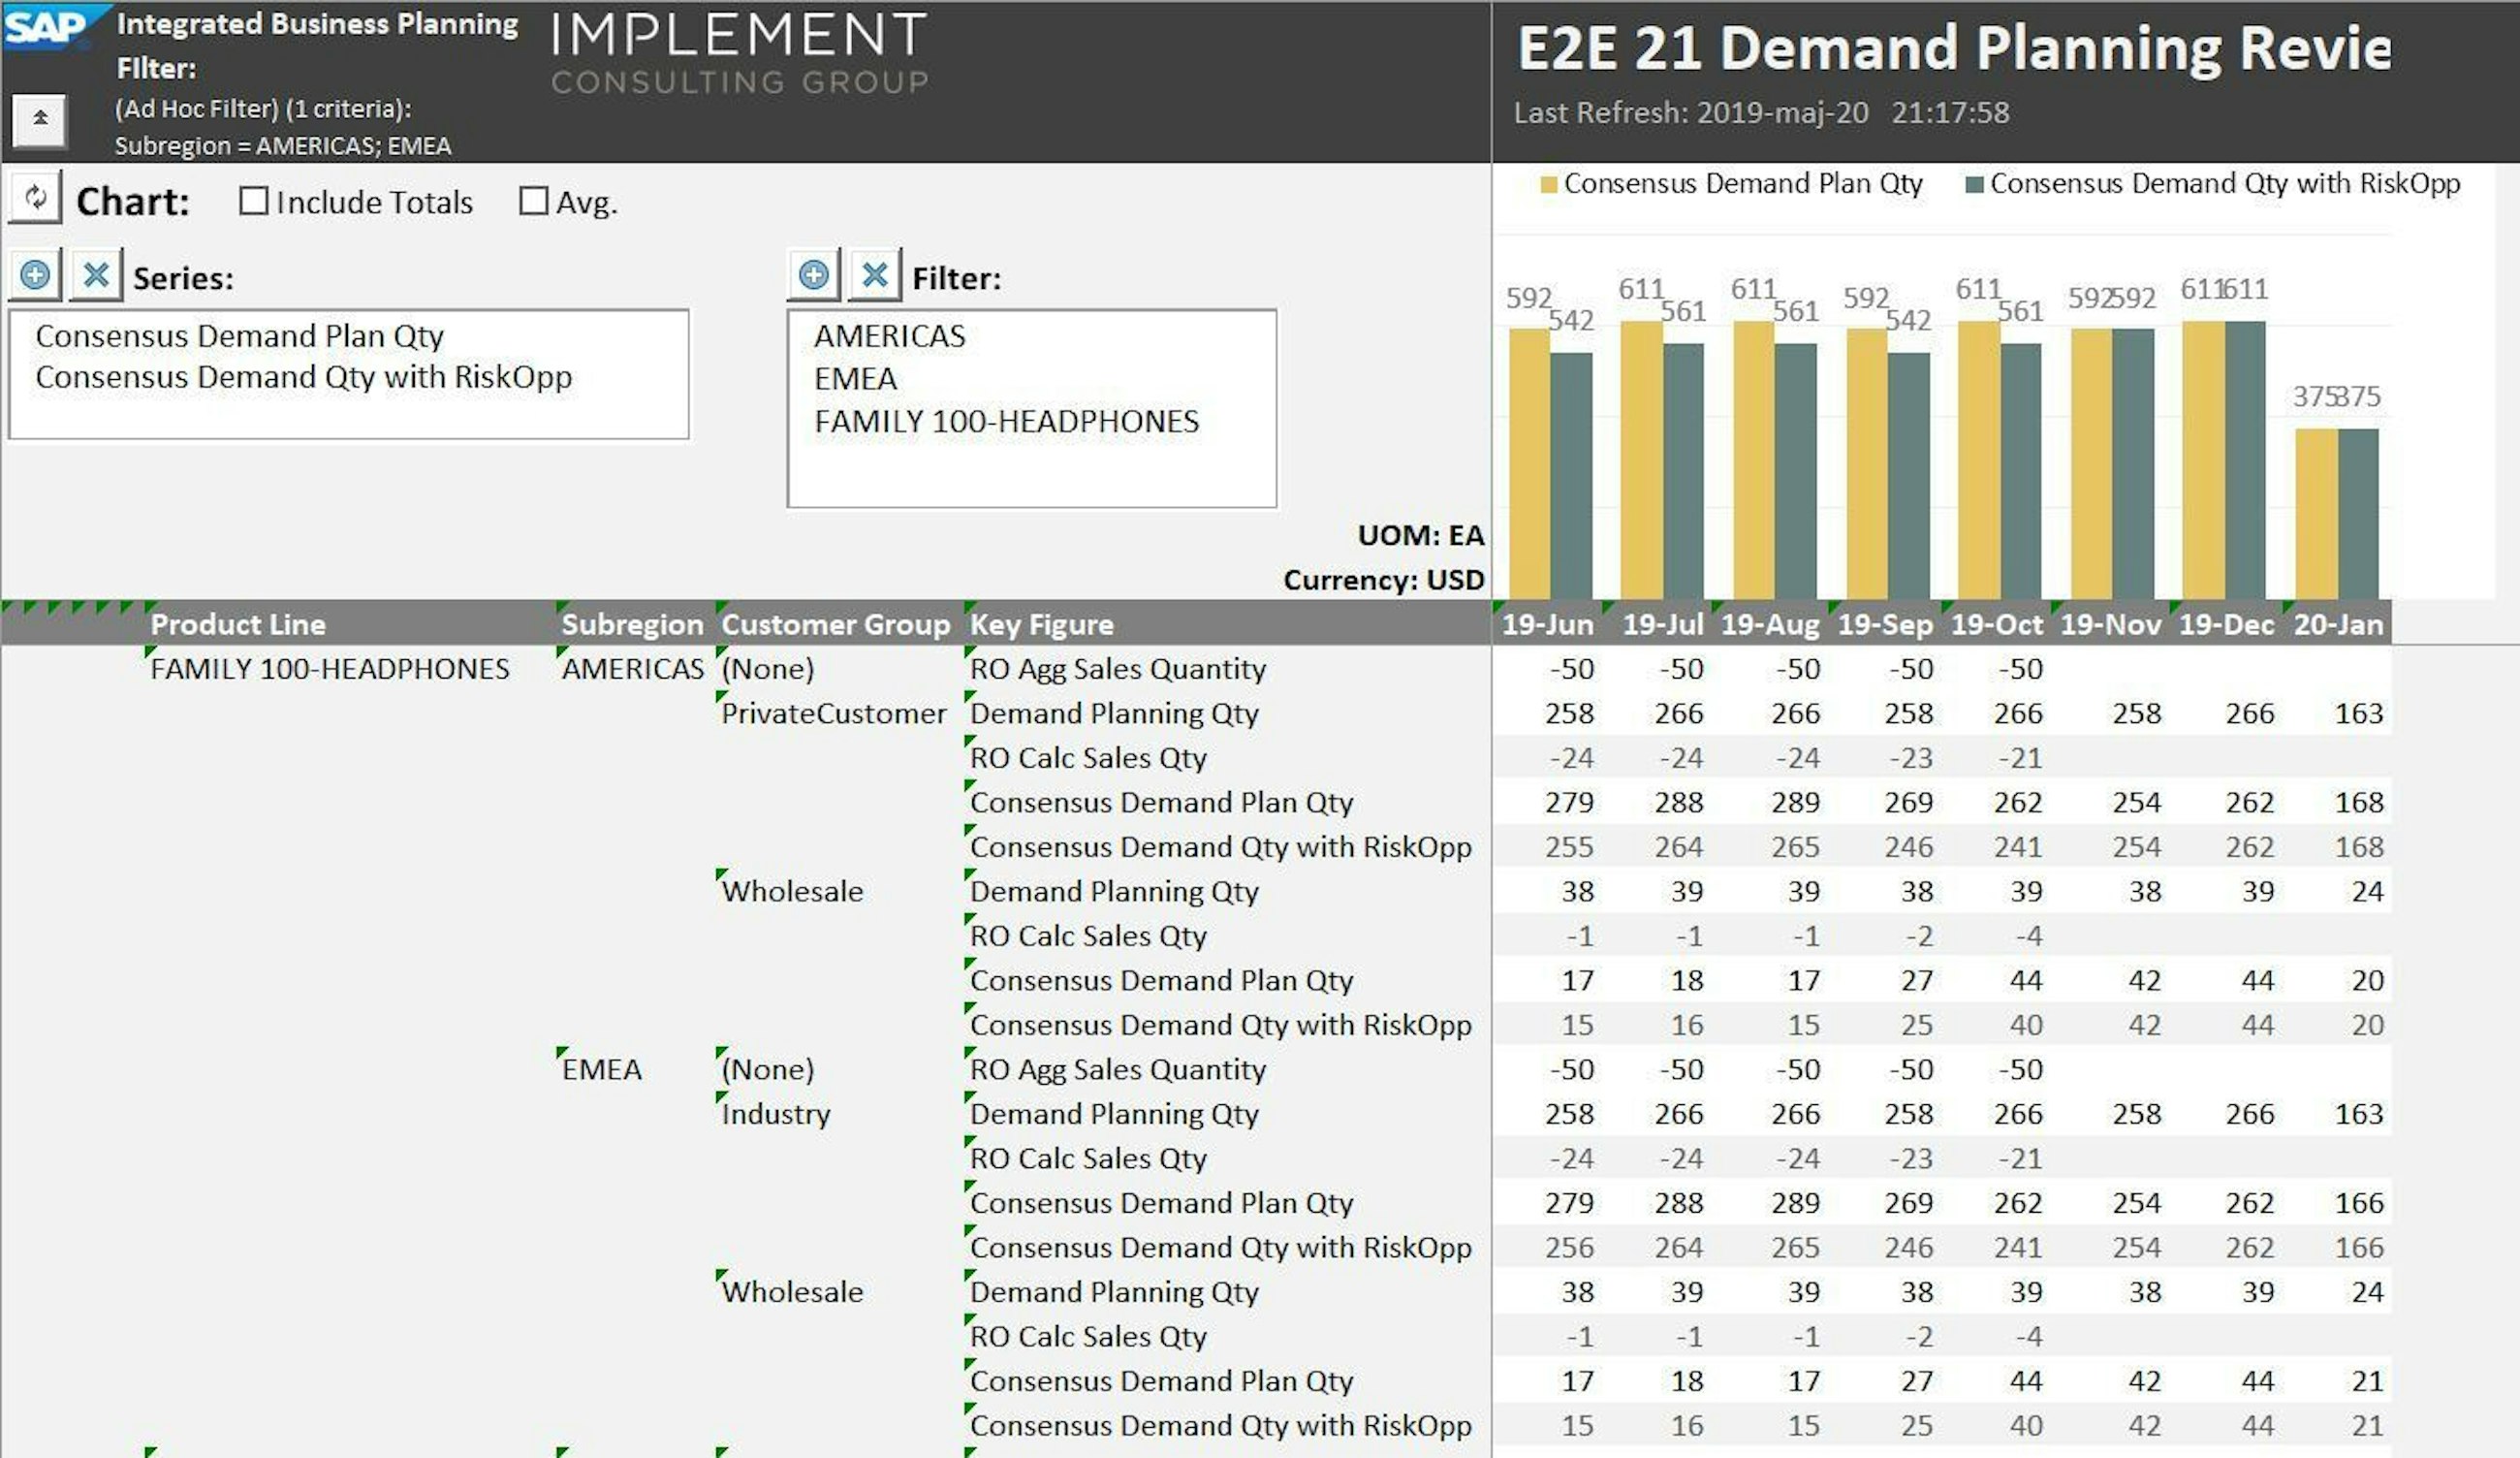
You can view the drivers maintained in the app in both the IBP Excel UI and the Web-Based Planning app so that you in a very visible way can show and account for their impact on the plan.
2. A new app enhances the way master data attributes are managed
When you implement any planning system, roles and authorisation design are certainly one of the key activities. You often need to restrict data in organisations so that information is only accessible by relevant people.
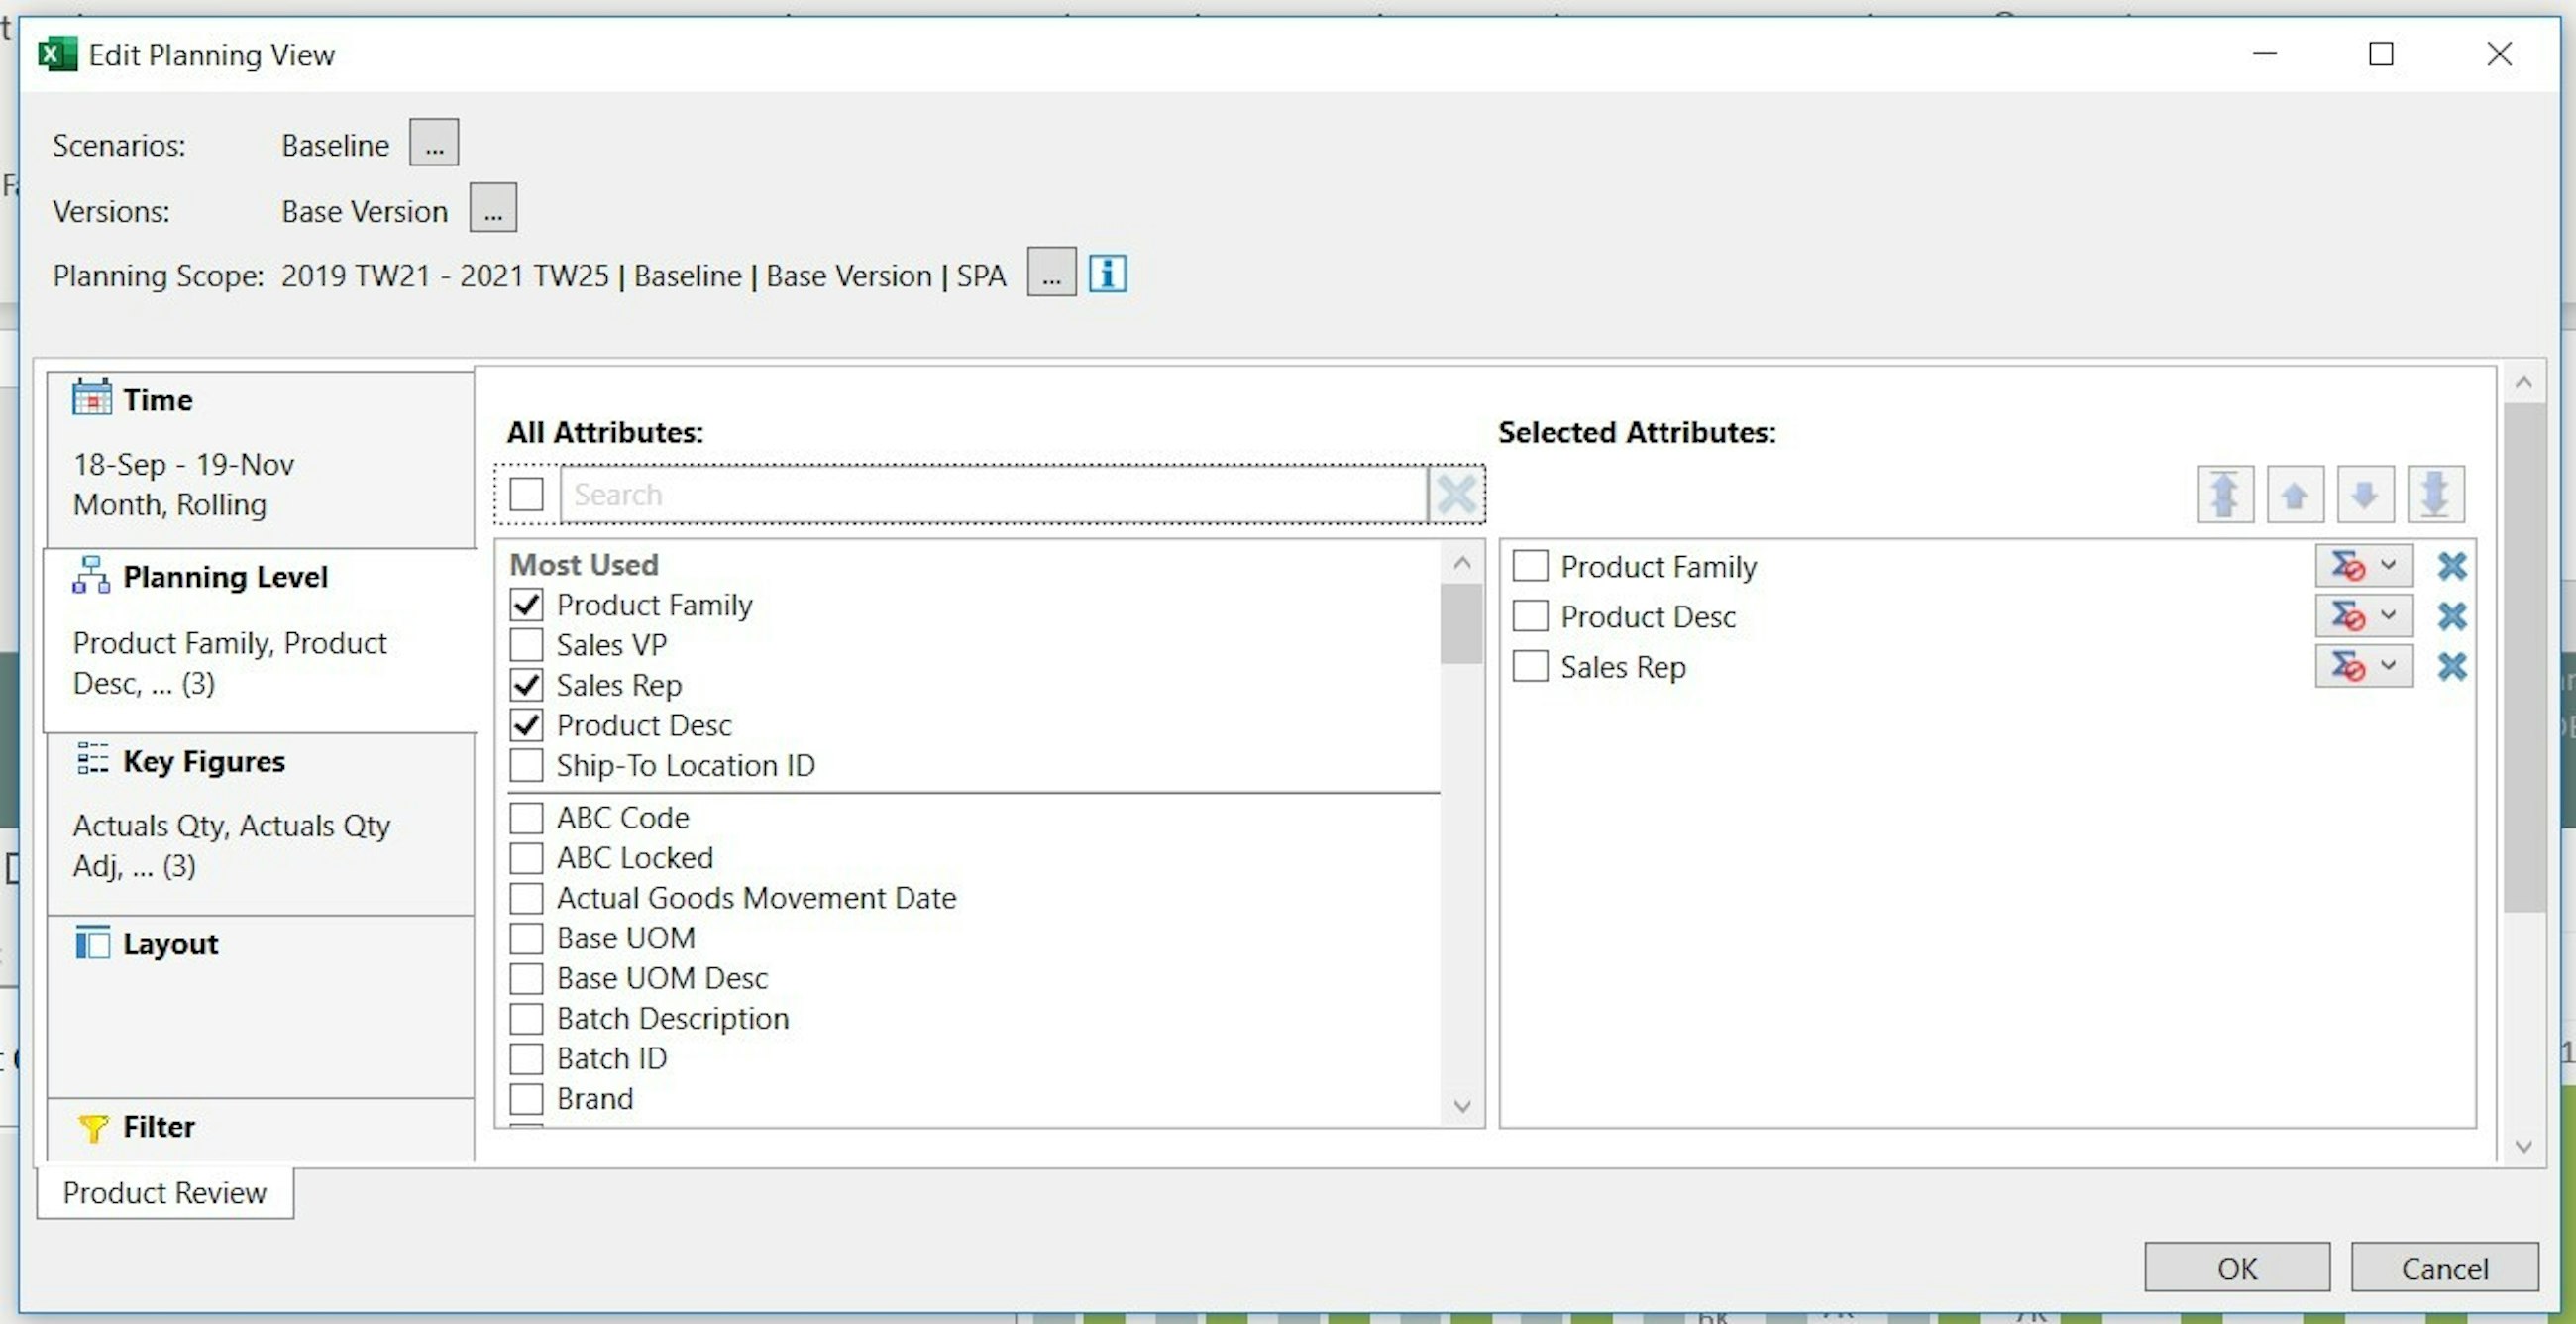
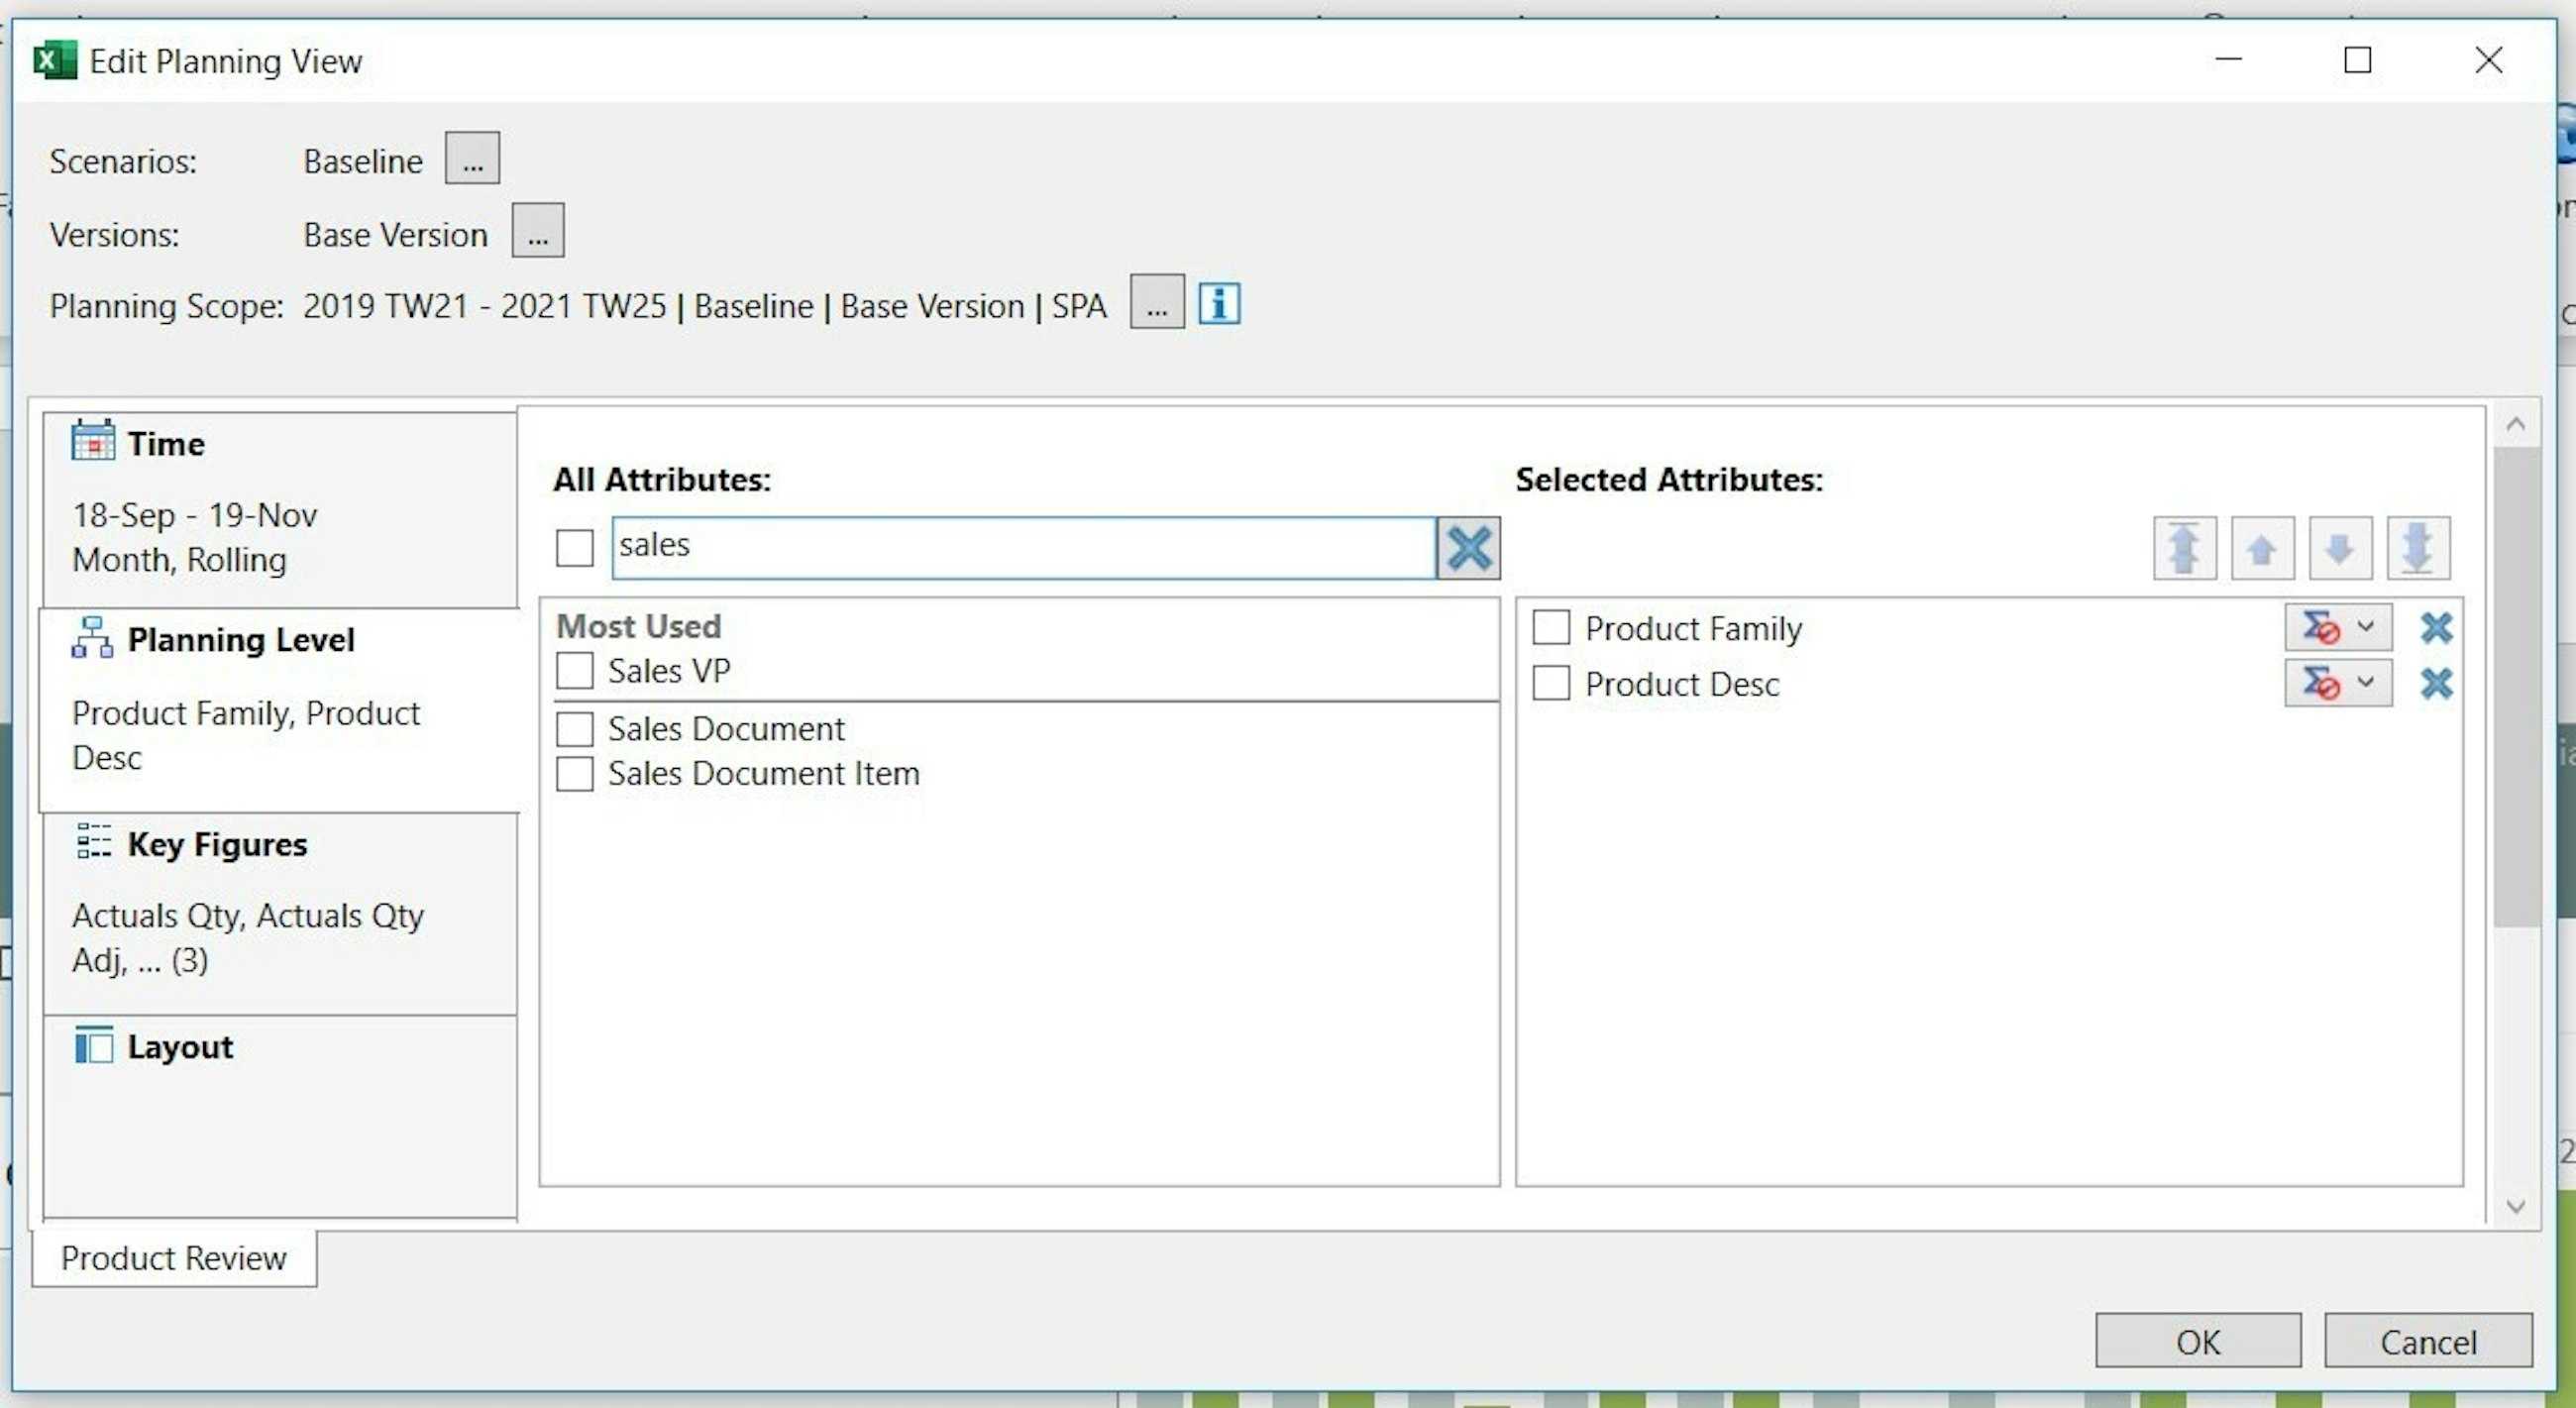
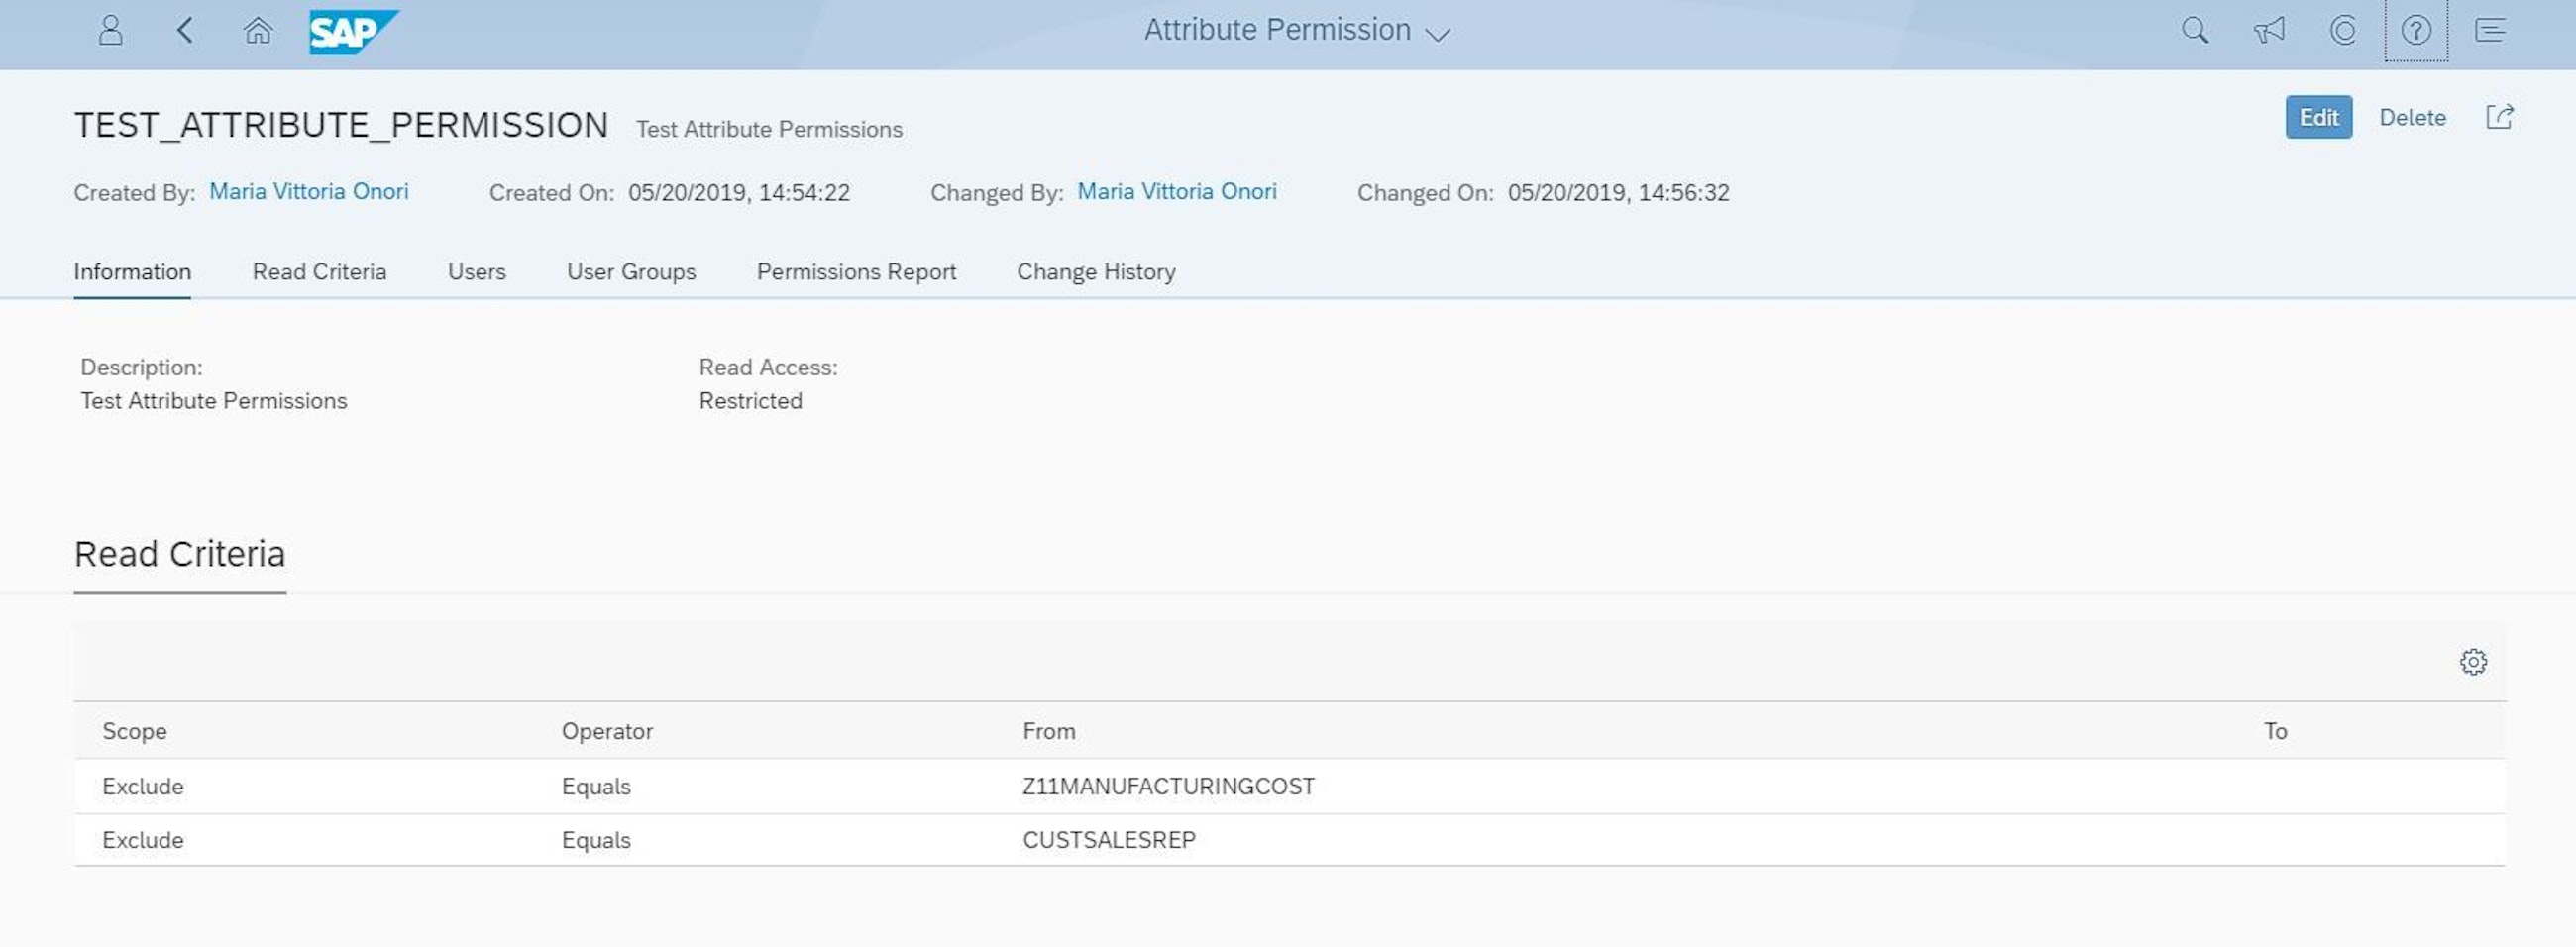
Until the previous release, you could restrict the users’ access to master data types and key figures with permission filters. With the 1905 release, permissions have been extended to the visibility of attributes. You can now restrict the users’ access to specific attributes in several IBP applications, such as the IBP Excel add-in, Planning Filters, Analytics and more. For example, the cost of producing a unit of product may represent sensitive information that you may not want the demand planners to see. Therefore, you could make the Manufacturing Cost attribute not visible for these users (or user groups).
You manage attributes restrictions in the newly introduced app “Manage Attribute Permissions”, where all business users will need to have attribute permissions assigned. If a user has no assignments, they won't be able to see any attributes. But fear not. After the upgrade to SAP IBP 1905, existing users will be automatically assigned the SAP_ALL_ATTRIBUTES permission so that nothing will really change for them. If the users’ access to some attributes needs to be restricted, all you need to do is assign to them a new attribute permission and remove the existing “unrestricted” permission.
To conclude, we believe that this new feature has the potential of achieving three key benefits: higher security in terms of data access, improved system performance by limiting the number of attributes and, most importantly, better user experience. The users will only see what is necessary for them without the inconvenience of having to see all those irrelevant “we might need in the future” attributes. We can say without a doubt that this represents a great improvement in terms of user friendliness.
3. DDMRP is now fully supported in a new sample planning area
With the 1905 release, the SAP3B sample planning area, used for DDMRP in Inventory, has been removed and replaced with the new SAP8 planning area for demand-driven replenishment. This means that DDMRP functionalities are now part of the Demand-Driven Replenishment license, which supports all five components of DDMRP. Prior to this release, when DDMRP was part of Inventory Optimization, only the first three components of DDMRP were supported.
With IBP for Demand-Driven Replenishment, you can now create DDMRP order recommendations and order generation (Demand-Driven Planning) and review priorities, inventory projections and buffer and signal integrity status (Visible and Collaborative Execution). To enable an end-to-end DDMRP process, your IBP add-on for ECC integration needs to be correctly configured, as here is where steps 4 and 5 are primarily performed. Here is how:
Provided data templates integrate replenishment proposals and buffer status (priority and colour) to SAP ERP, where a specific “DDR cockpit” is provided. Here, a Demand-Driven Heuristic converts the replenishment proposals to demand and supply order elements, such as planned orders and purchase requisitions. The Heuristic also creates demand and supply data that are going to be used for planning. This information is then sent back to IBP along with on-hand inventories and master data updates.
With the ECC add-on for IBP, you can analyse the results of the DDMRP heuristic run and review the priorities of execution tasks such as product planning and material replenishment planning. In IBP, you can visualise and review inventory projections to decide for example if an existing supply order must be expedited, or to review buffer and their status to decide for example if the buffer sizing or net flow signal might require special attention. To do so you have different options. The Analytics app, the Dashboards app, the DDMRP Buffer Analysis app and the IBP Excel add-in too.
4. Several new and improved features help you get the most out of your analytics
With the 1905 upgrade of IBP, a number of improvements have been made to Analytics, which altogether contribute to drastically enhancing the look and feel of this app.
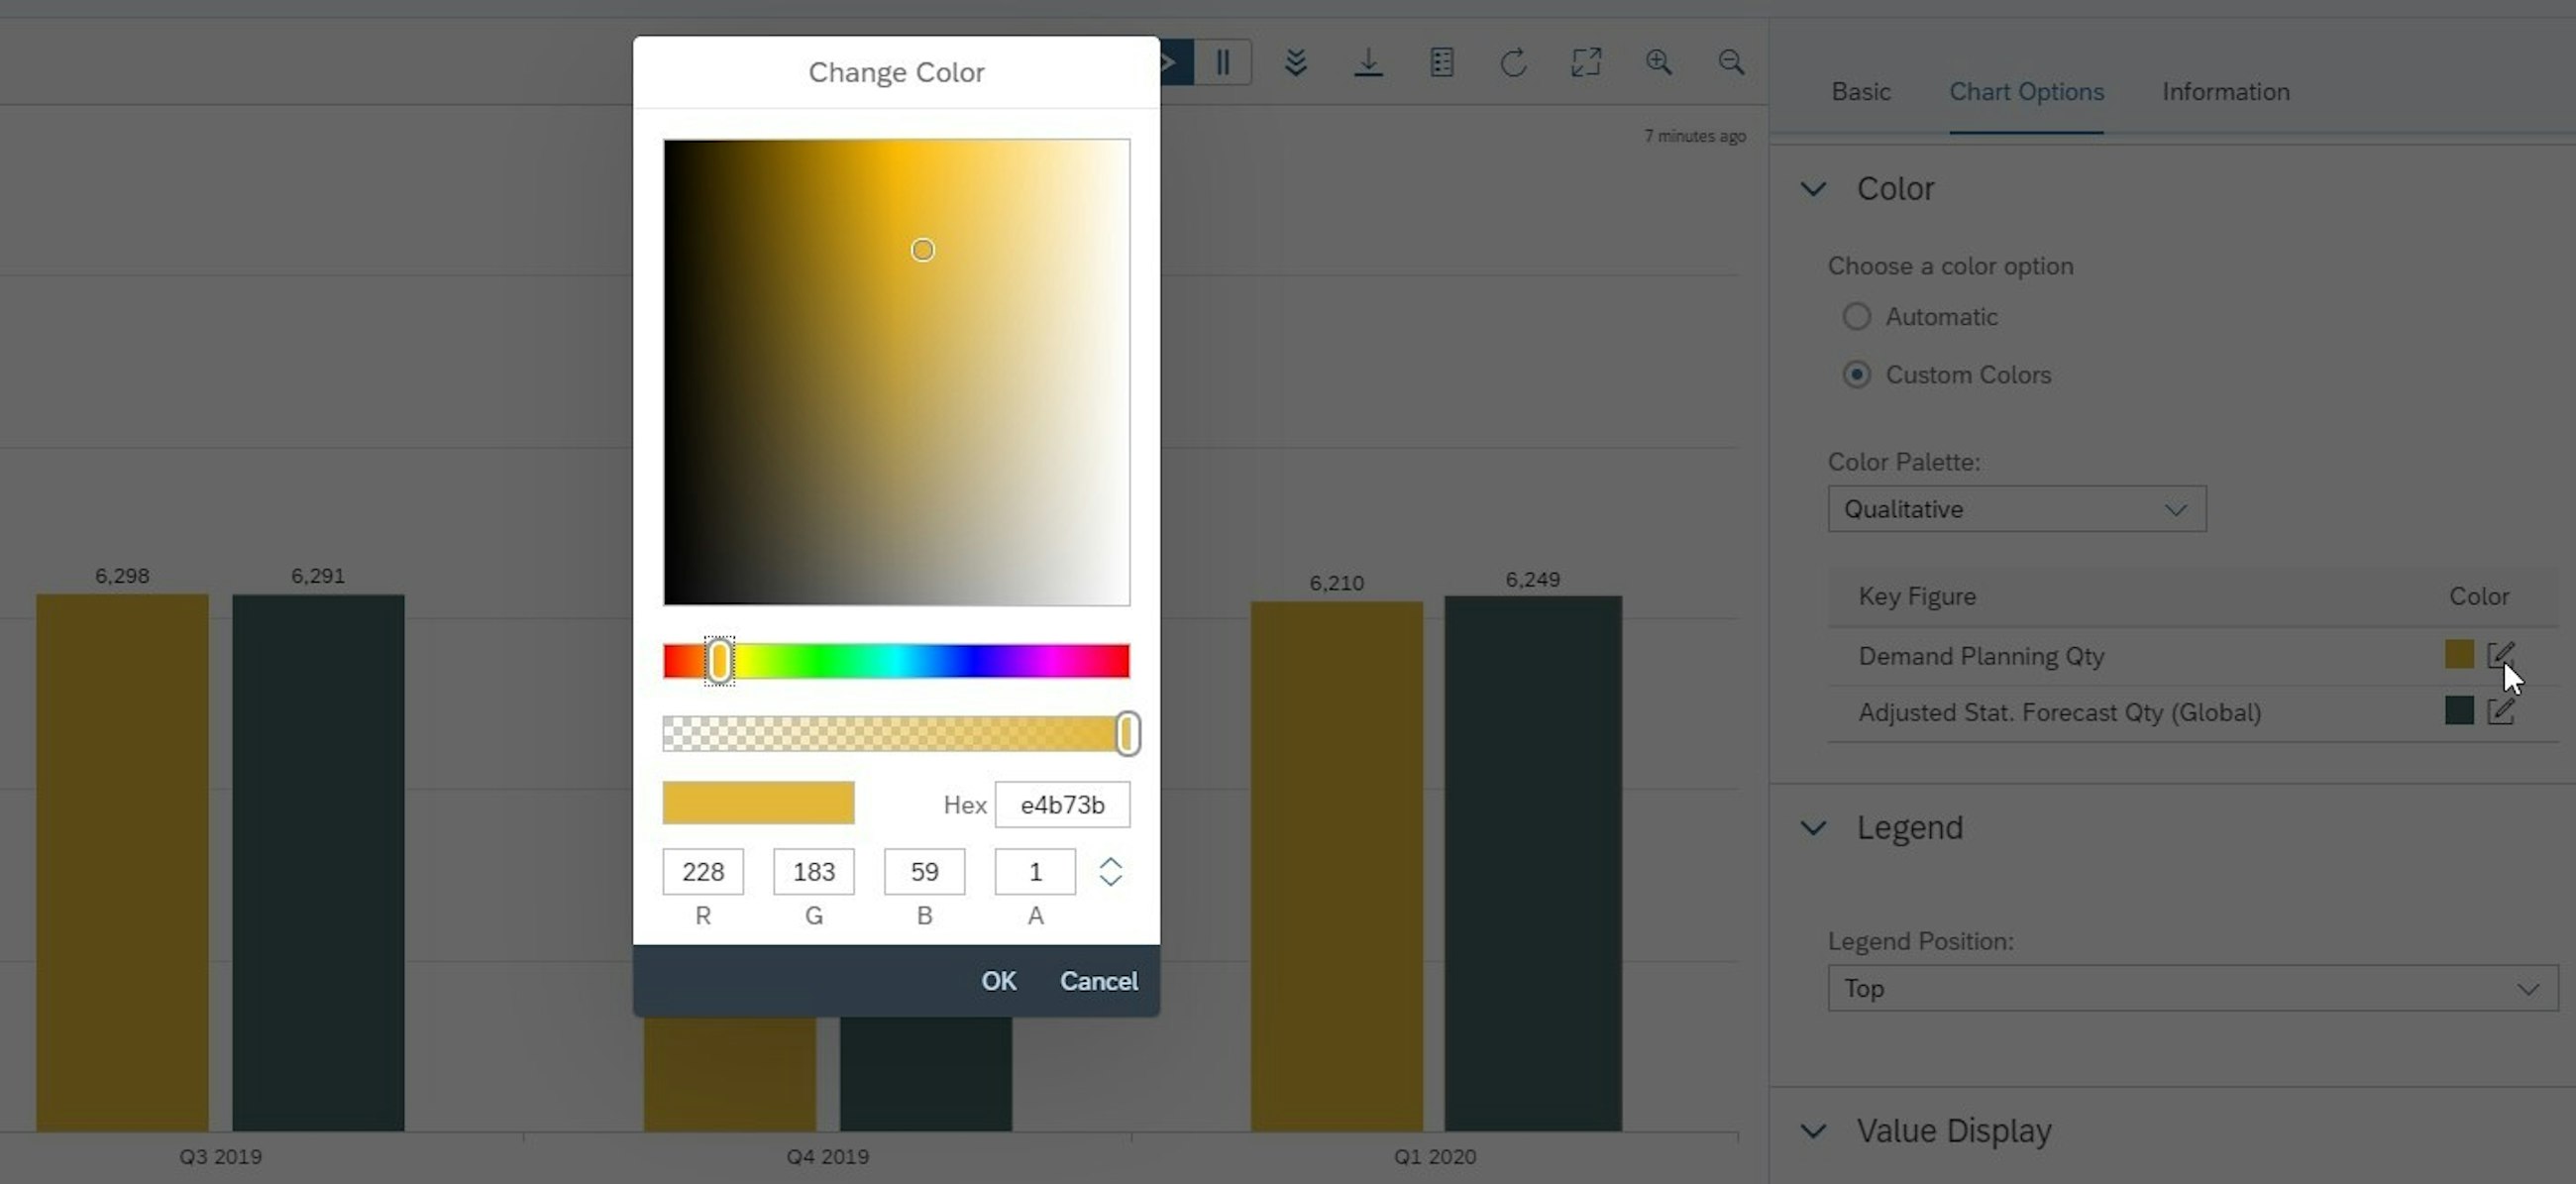
One of the most long-awaited features is probably the new colour picker, which has been introduced to allow customised colouring of each key figure. Besides 15 predefined colours, you can select any RGBA combination and finally be able to use your company’s colours for your charts.
If you are using a choropleth or a geo bubble chart type, you can now associate a particular colour to defined thresholds – and the new colour picker is available here too.
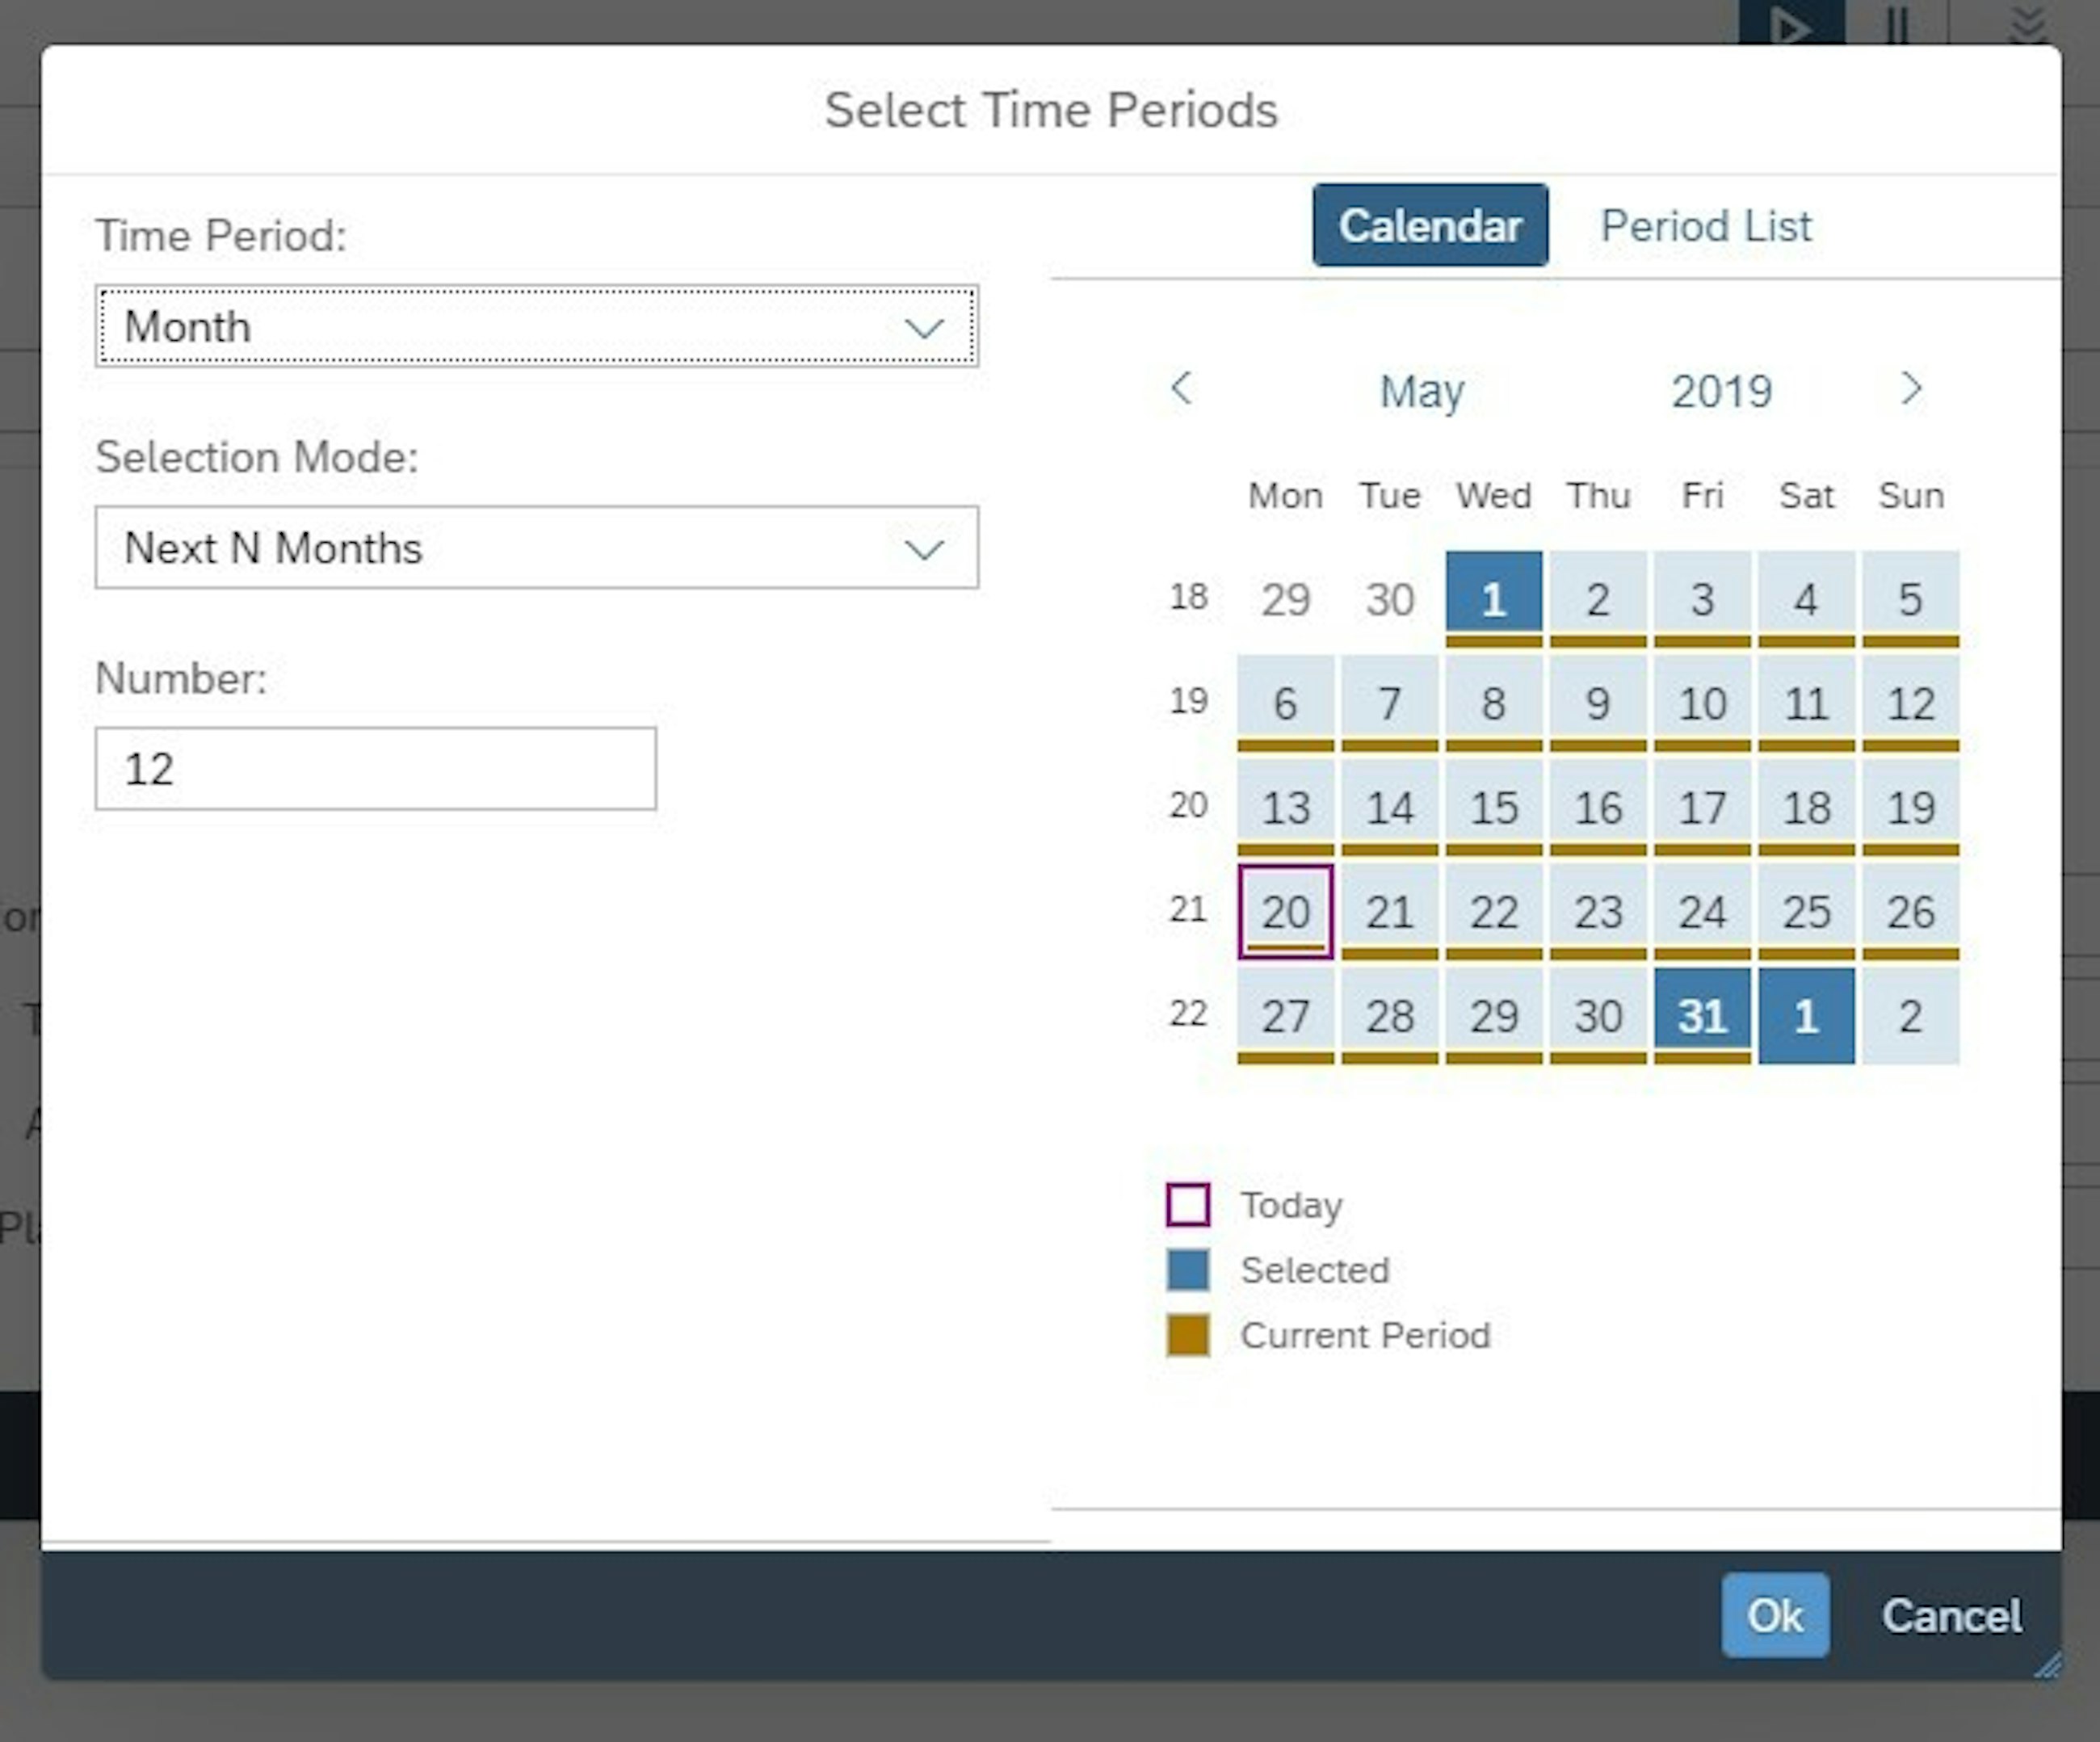
Up until the previous release, the way you selected the time range for your chart was not the most efficient. To select for example 12 months in the past, you needed to select each and every of these months. With the 1905 upgrade, time selection has been enhanced by a new, flexible and usable control where you can choose the relevant time bucket (days, weeks, months etc.) and different selecting modes, such as month range, multiple months, previous or next months. To select the time periods, you can then use a calendar or the “old” period list.
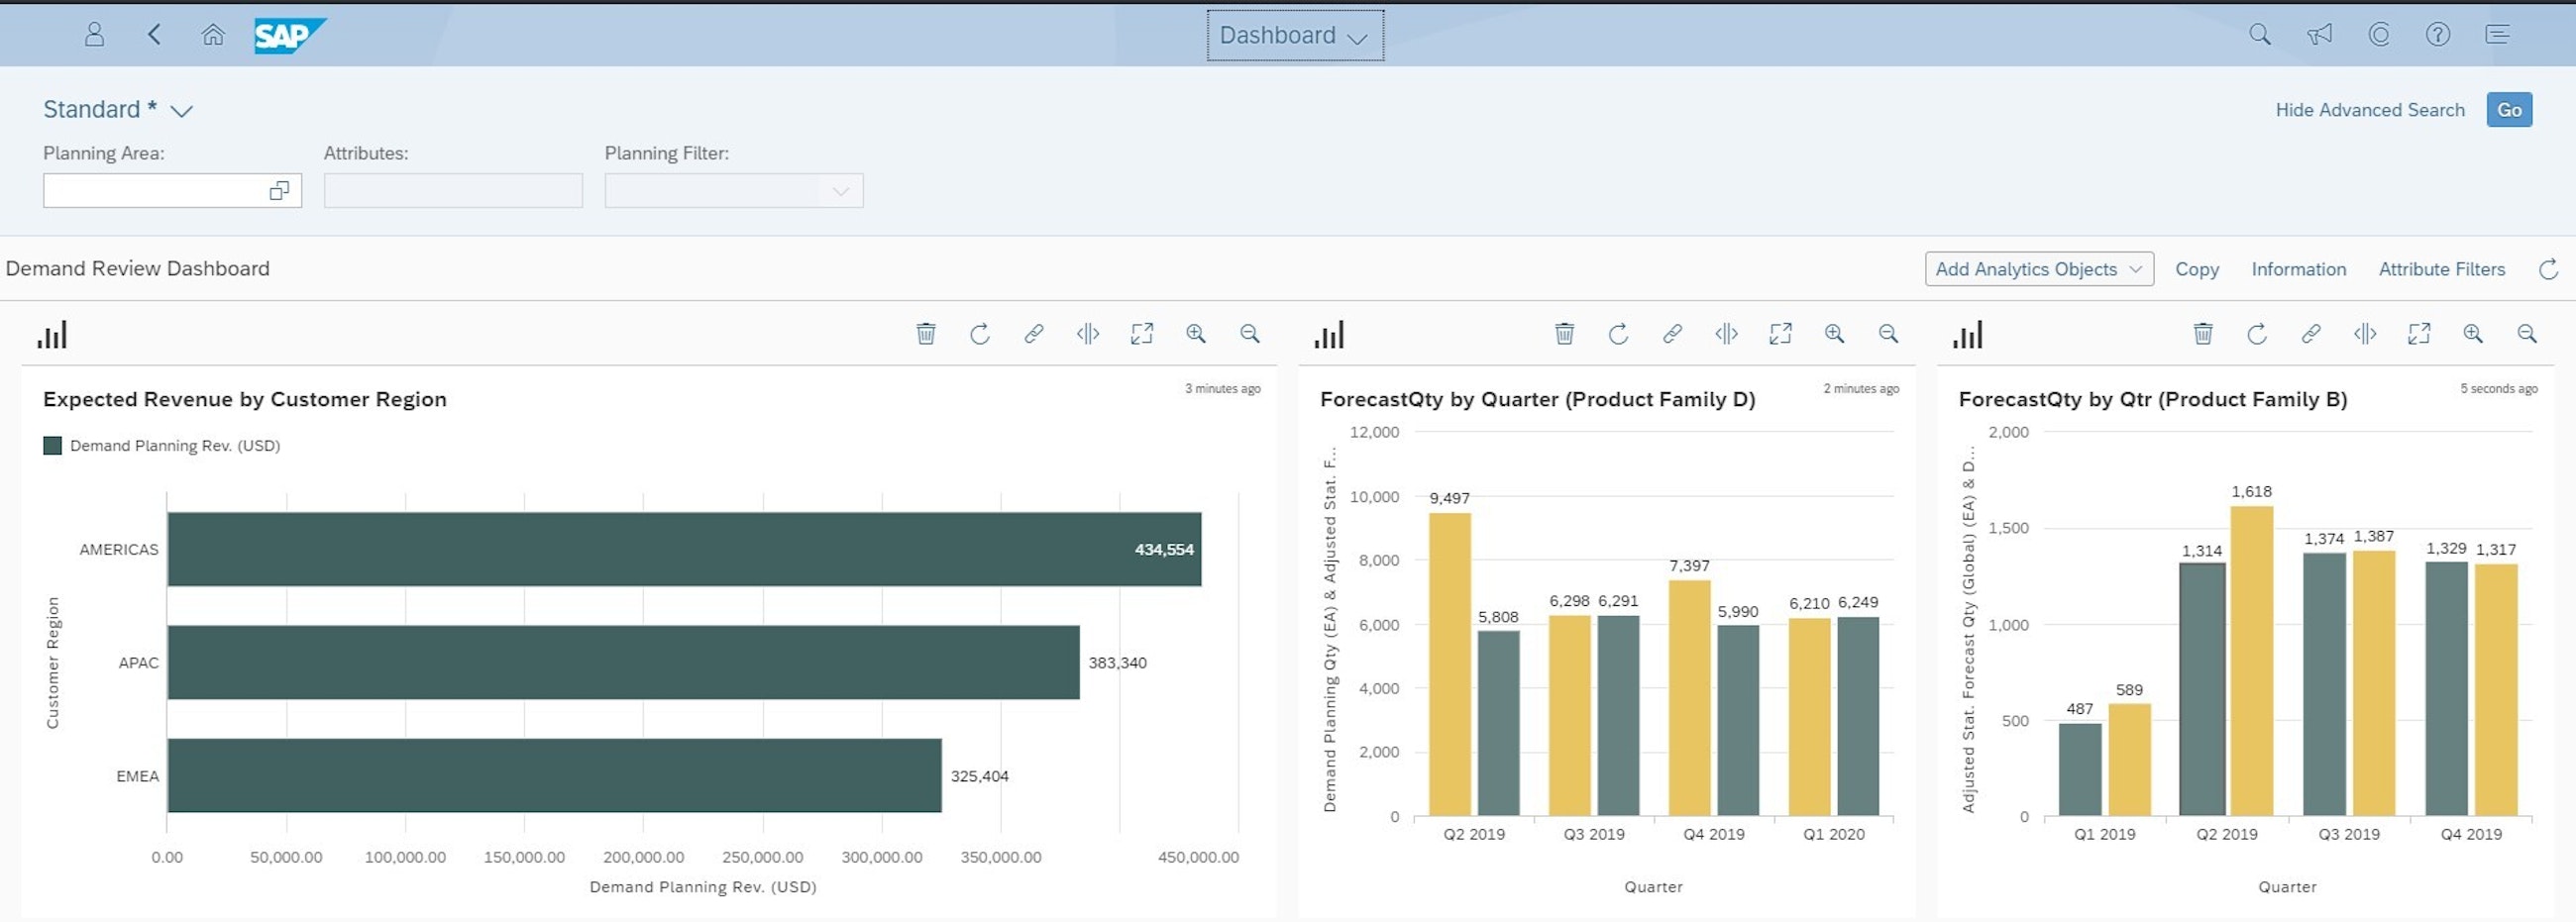
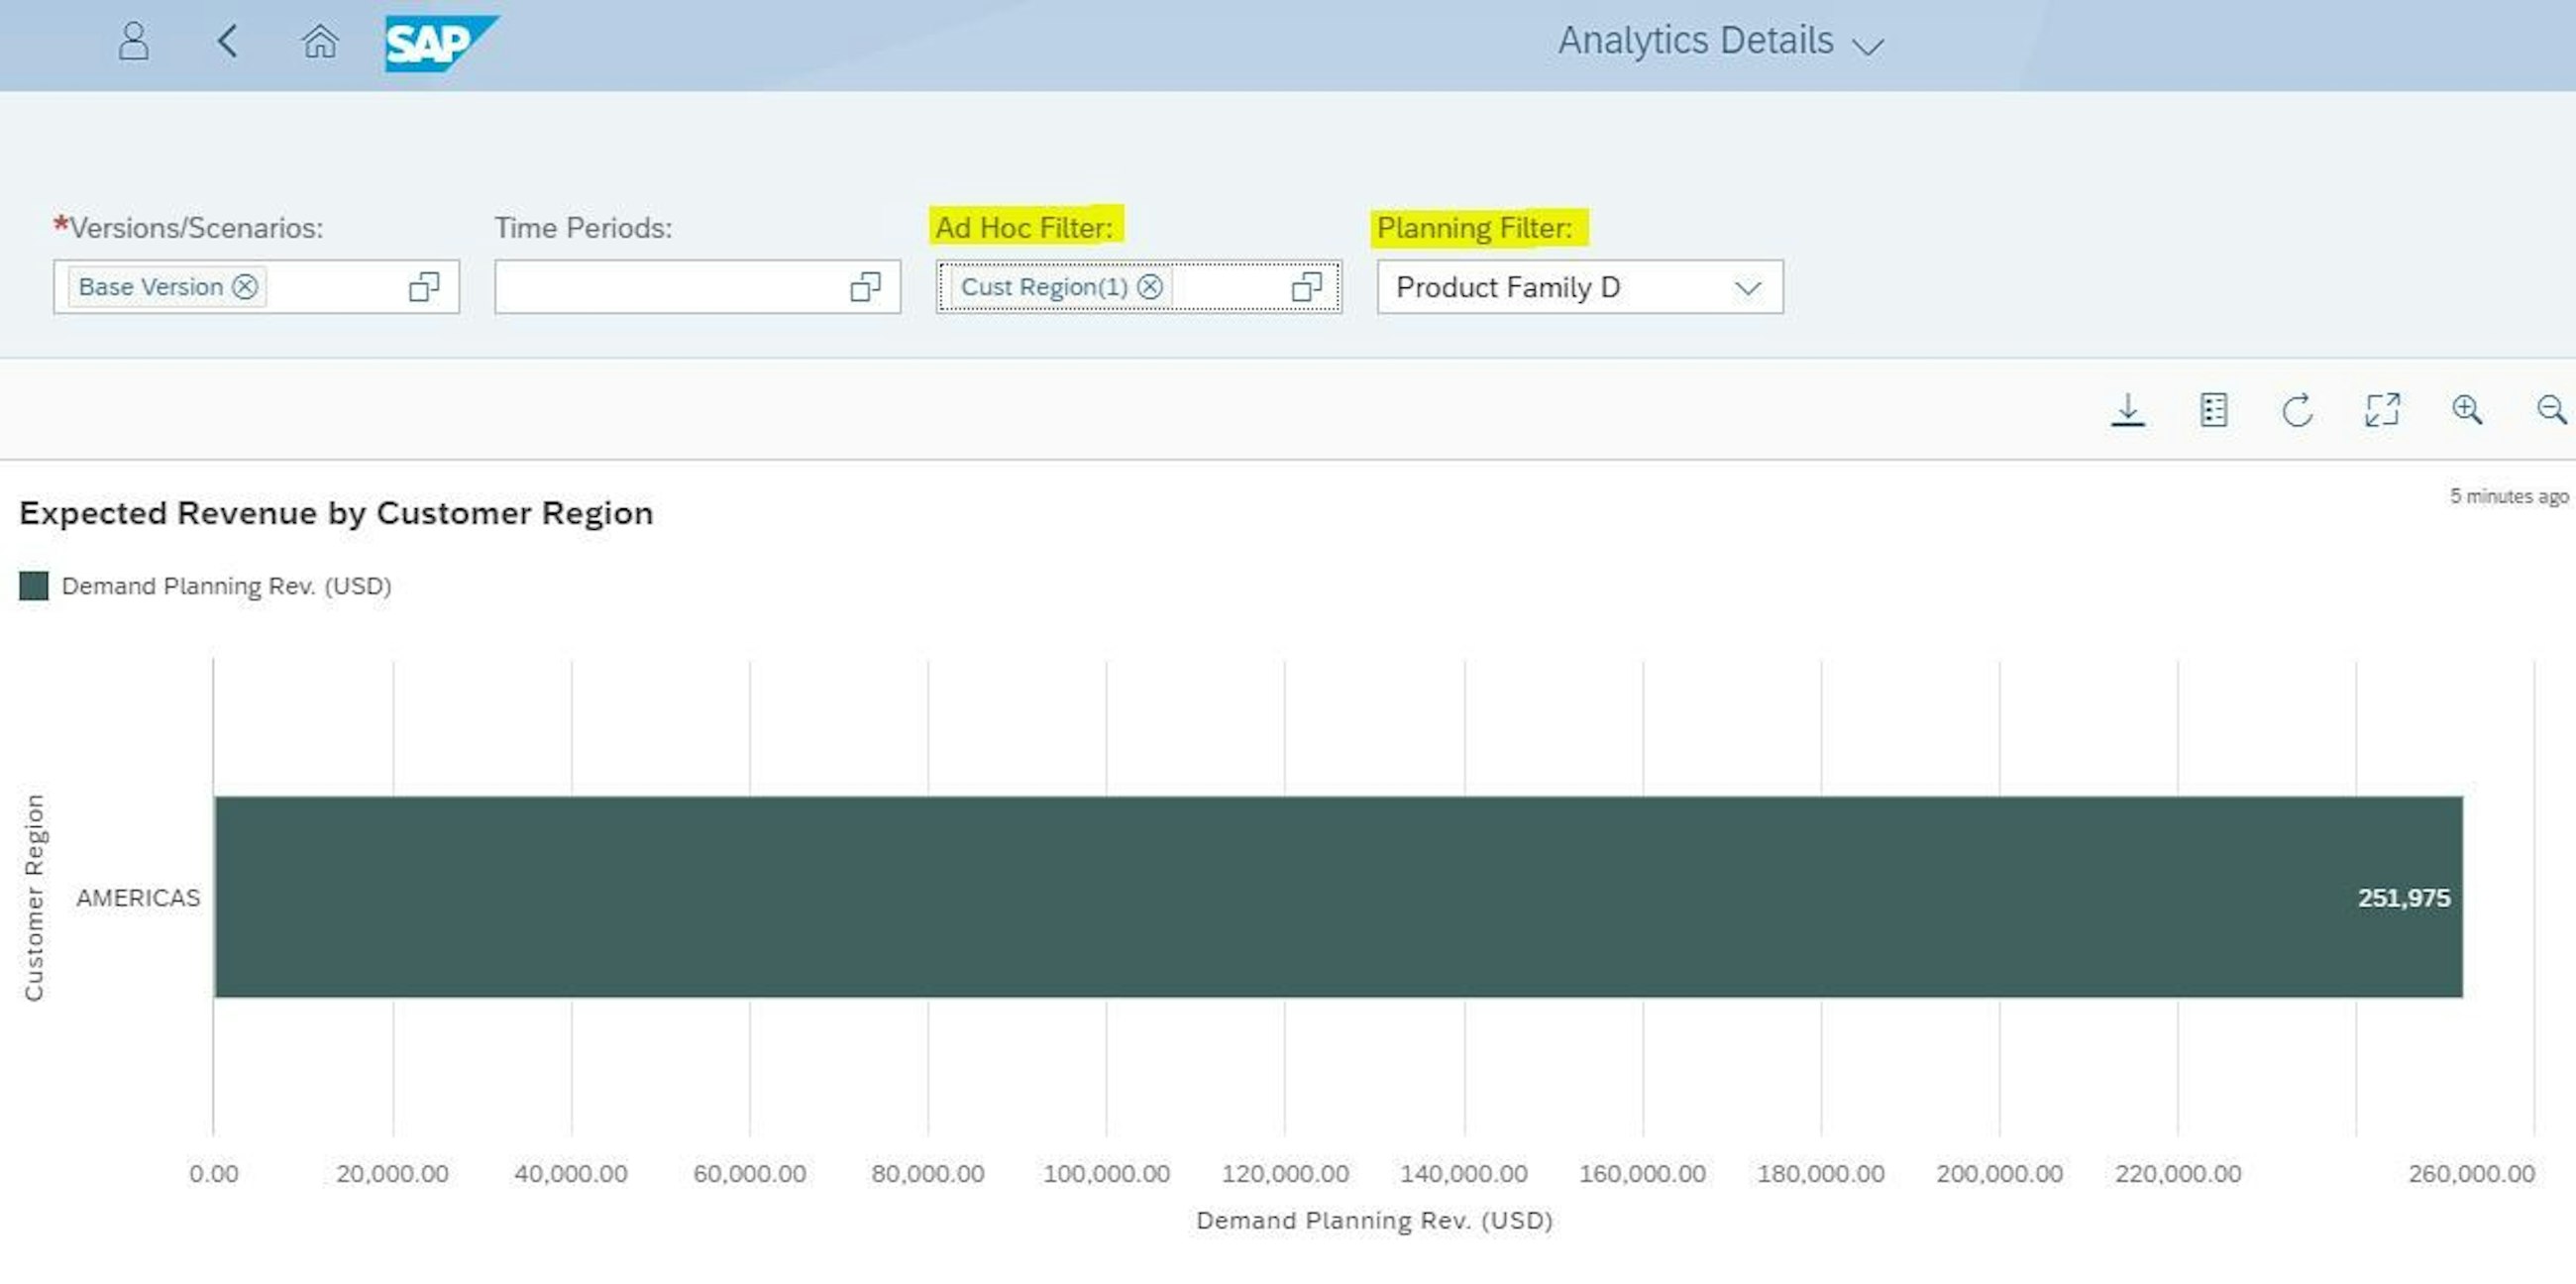
Other enhancements include the use of filters in charts. You can now filter data in your charts based on multiple key figures’ values, so that you are only shown what is most relevant for you. What’s more is that planning filters (defined in the Planning Filters app or directly in the Excel UI) can now be applied to your charts, where they can be used in combination with ad hoc filters. You can also use planning filters directly in Dashboard and in Custom Alerts, making it quicker to focus your attention where it is most needed.
5. New advanced statistical modelling is now possible with (S)ARIMAX models for multi- variate time series forecasting
Advanced statistical modelling has golden days and is expected to yield a lot of benefits with machine learning and artificial intelligence. In 1802, IBP enabled ARIMA and SARIMA forecasting models, which can be considered an extension to exponential smoothing algorithms but focusing on the autocorrelation of the data. However, for advanced models to predict the demand, it requires considerable sales history to be available, and for many companies the opposite is true due to more frequent product launches and decreased product life cycles.
In 1905, you can now have Auto-ARIMA and SARIMA models with explanatory variables ARIMAX and SARIMAX. The value of the explanatory variable, known as the exogenous variable, is determined outside the model but affects the result of the model. This means that the requirement for the ARIMAX model is that you have an explanatory variable that you know the value of in both the past and the future, as you need data points in forecast period as well to impose the ARIMAX model.
The problem is of course to find reliable explanatory data in the future that impose value to the model. An example to consider could be the seasonal index, which is calculated based on the past but offset into the future. Although SARIMA models already are modelling seasonality, it could make sense in some cases to force the recent seasonality pattern into the training and forecast of the model. However, we advise you to use such models with caution and focus on the simple value-creating process steps.

